The challenge
This month’s PTC Mathcad challenge is inspired by the greatest rock band of all time: Rush! Specifically, it is in honor of the 50th anniversary of their concept album 2112, which gave us the Starman logo. Nearby you can see the logo along with geometry made in Creo pertaining to the challenge.
The challenge was as follows: start with a circle of radius 1. Inscribe a regular pentagon. Connect the vertices to form a star.
Challenge 1: Measure the area of (1) the star, (2) the pentagon inside of the star, and (3) the tips of the star (the star minus the interior pentagon).
Challenge 2: Write functions for these areas in terms of the original circle radius r.
Challenge 3: Inside of the first star is another regular pentagon. Repeat the process: connect the vertices to form another star. Measure the same three areas as in challenge 1.
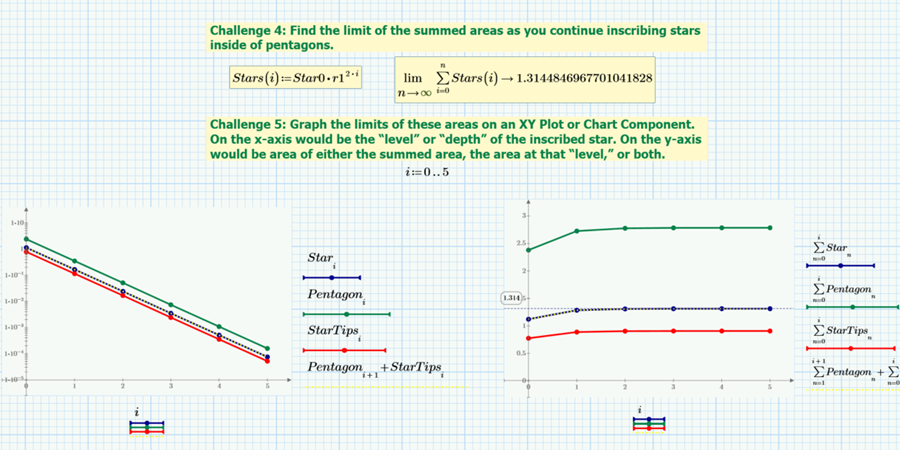
Challenge 4: Find the limit of the areas as you continue inscribing stars inside of pentagons.
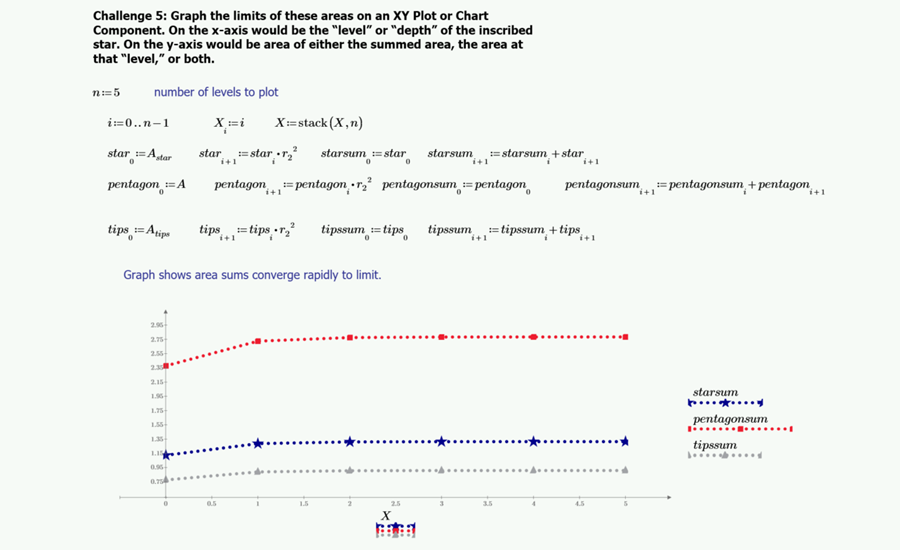
Challenge 5: Graph the limits of these areas on an XY Plot or Chart Component. On the x-axis would be the “level” or “depth” of the inscribed star. On the y-axis would be area of either the summed area, the area at that “level,” or both.
The submissions
This month had submissions from loyal challengers Alan Stevens and Professor Tokoro.
Alan’s worksheet started by defining vectors to graph the original circle, pentagon, and star in an XY Plot. He solved challenge 1 using the formula for the area of a pentagon. He figured out the scaling factor between the big pentagon and the pentagon inside the star. He then deduced the area of one tip using the formula for a triangle. Multiply by 5 to get the area of all tips. Add the area of the inner pentagon to that of the tips to get the area of the star. It’s a very direct approach.
Calculating formulas for the areas is a matter of multiplying by the radius.
For challenge 3, Alan flipped and scaled the original pentagon and star to draw the inner pentagon and star on the XY Plot. Then it was a matter of computing the areas using the previous functions, with the scaling factor as the radius.
Alan then calculated the limiting sums of the areas taking advantage of the geometric progression. His graph shows that the sum quickly converges to a limit. The entire solution is direct and elegant. (It was also created in Mathcad Express.)
I like how Professor Tokoro’s worksheet plots the star and pentagon on a 3D plot, perhaps four or five levels deep! Then he declares, “If we can plot the challenge, it may be solved.”
If we can plot the challenge, it may be solved.
Tetsuro Tokoro; Electrical Engineering Professor; National Institute of Technology (KOSEN), Gifu College
Read His Community Spotlight
There is quite a bit of initial math involving matrices, a range variable, vectorization, programs, and symbolic evaluation with keywords in a collapsed area and the draft view. A second collapsed area contains programs for filling in surfaces with color in 3D Plots. An ambitious person could take the functions from this worksheet and some of his previous worksheets (like the Art Gallery Problem) to create a graphics package for Mathcad.
Professor Tokoro takes a different approach than Alan for solving the area. He uses summations and symbolic evaluation. He also uses the proportion between one pentagon and the next interior level to calculate the areas of the pentagon / tips / star in subsequent levels. He solves the limit of the area using, appropriately, the limit of a summation.
An XY Plot depicts the decreasing area at each level. By using a logarithmic scale on the y-axis, it produces a straight line! That’s an unexpected insight.
What can we learn?
This was a 2D geometry problem essentially involving areas of pentagons and triangles. Yet we have two radically different approaches in Mathcad Prime. Regardless of whether you prefer a direct calculation method or a symbolic evaluation-based approach, Mathcad Prime supports your solution. The graphing tools enabled both Alan Stevens and Professor Tokoro to depict both the initial problem and conclusions regarding convergence.
(Also, as I am writing this, Rush has kicked off their “Fifty Something Tour”. That endurance makes me think of geometric progression.)
Up Next
Stay up to date with the Mathcad Minute
Subscribe to Mathcad’s newsletter to learn when new Community Challenges go live, plus much more.
Subscribe Now