In my role at PTC, I frequently meet with cross-functional teams to discuss how PLM can support ESG initiatives. The first question I always ask them is “what KPIs do you use to evaluate your supply chain?”
Although specific KPIs tend to vary, I find that they fall into six common categories—confirmed through my review of sustainability disclosures from 38 PTC Retail customers.
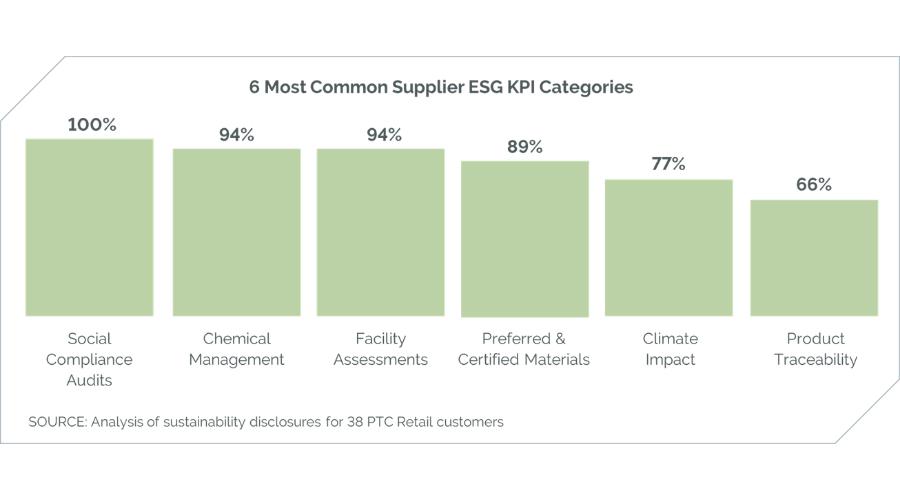
Passing social compliance audits
Everyone reports on these audits because supplier labor practices directly influence brand reputation. Key KPIs here include:
- The percentage of tier one and two suppliers that pass third-party social audits and who have made progress on corrective action plans.
- Zero tolerance for forced labor or child labor.
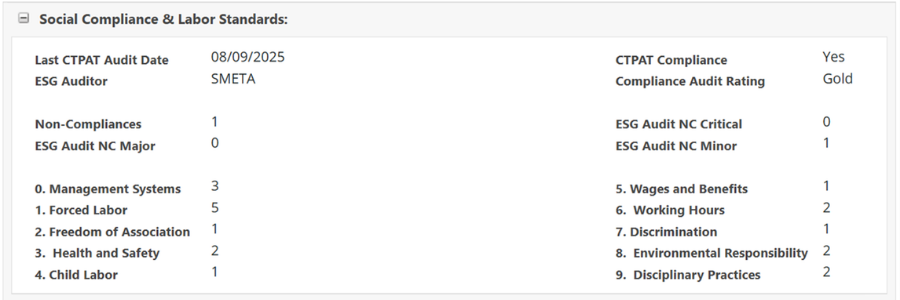
Most retailers add the Social Compliance attributes to support these KPIs to their Supplier records in PLM. At a minimum this typically includes the audit date, who conducted the audit, the overall rating, and whether it meets the retailer’s standards. As shown below, some retailers go deeper by providing non-compliance counts and individual scores from each category. I have even seen retailers incorporate specific audit results such as percent female workers or worker engagement scores.
No restricted substances
Nearly all retailers measure their supply chain’s adherence to its Restricted Substances List (RSL) that align with established standards such as Zero Discharge of Hazardous Materials (ZDHC), OEKO-TEX®, or bluesign requirements. The common metrics here are:
- Percent of suppliers that are certified by level of compliance (e.g., Foundational vs. Progressive)
- Full transparency of input chemicals used in factories.
Many retailers require suppliers to fill out these attributes and upload supporting certificates to PLM with sourcing managers responsible for validating the data.
Facility assessments
Most retailers track completion and verification rates for Worldly Higg Facility Environmental Module (FEM) assessments across their tier one and tier two suppliers.
Retailers with high completion rates often set and track additional supply chain performance goals. For example:
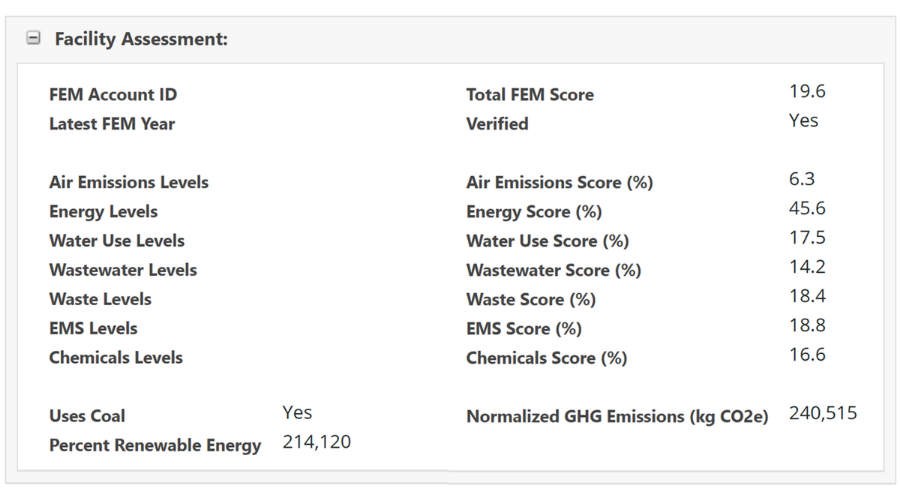
- Brooks Running expects 100 percent of tier one and 80 percent of tier two suppliers to achieve Higg FEM Level One or higher across each of the seven categories—Air Emissions, Energy, Water Use, Wastewater, Waste, EMS, and Chemicals.
- Lululemon keeps track of the percentage of tier one and tier two suppliers who have eliminated on-site coal usage.
As shown below, PTC’s integration with Worldly FEM allows users to evaluate assessment results for each of these basic and advanced metrics in PLM, as well as any of the 1,200+ FEM survey responses.
Preferred & certified material certificates
Most retail, footwear, and apparel brands have explicit goals to use 100 percent sustainably-sourced materials by 2030. Reporting progress against these goals requires:
- Valid scope certificates for all materials containing a breakdown of the material content (e.g., percent organic, percent conventional, percent bio-based, percent recycled).
- Per unit weight of each material that appears in each product’s BOM.
- Each material’s yield/consumption in each product’s BOM.
- Actual or forecasted units for each product in a season.
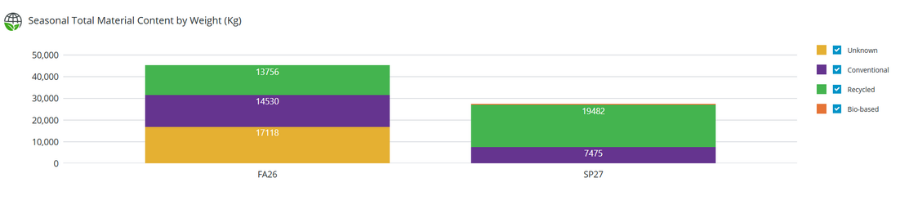
These data points make it easy to calculate the total consumption and weight of each material for an entire season, along with the total weight for each content type. As shown below, aggregating these content weights across all materials generates season-level breakdowns of each content type.
Many PTC customers manage material certificates—FSC, LWG, RCS, and the like—in PLM. Since very few of these certification bodies have rest services to support integrations, their certificates are typically uploaded manually in PLM to document libraries connected to the material supplier.
Retailers often capture additional certificate details in PLM to further support their sustainability efforts. For example, issue and expiration dates ensure material certificates are valid for the relevant product season(s).
Capturing country of origin splits from certificates serves two purposes. First, it allows retailers to calculate the overall source of each raw material (e.g., 70 percent of cotton originated in India). Second, and more importantly, it supports French AGEC legislation which mandates that companies provide detailed country-of-origin information about where each step in a product’s manufacturing process occurred.
Reducing climate impact
Retailers prove they take climate change seriously by making progress towards reducing their greenhouse gas emissions. 76 percent of the retailers I reviewed have explicit Scope 3 reduction targets because it accounts for roughly 90 percent of their emissions,
If the lag measure is reduction in Scope 3 emissions, retailers’ primary lead measure is the percent of their suppliers who have adopted Science-Based Targets (STBi). For example, Carter’s reports that 59 percent of their suppliers by spend have established STBi targets.
In PLM, retailers can track not just whether a supplier has an STBi target, but also the type of target, what the target is, and how the supplier is progressing against it. Weighting these numbers by spend enables supply chain managers to identify emissions hotspots they can focus their attention on.
Product traceability
Product traceability has become a mainstream requirement due to increased regulatory pressure, consumer demand for transparency, and the need to manage global supply chain risks. It primarily consists of disclosing lists of tier one factories, mapping tier two suppliers, and verifying the origin of raw materials. Case in point, VF Corporation’s recent ESG report says that it traced 61 percent of key materials all the way back to their point of origin.
Details about tier one (finished goods manufacturers) and tier two (material suppliers) are almost universally captured in supplier libraries in PLM. Most retailers stop with tier two because they lack visibility into the lower tiers.
The advent of traceability solutions like TrusTrace, Sourcemap, and Textile Genesis gives retailers the data they need to:
- Build out their tier three, four, and even five supplier libraries in PLM.
- Create complete supply chain maps for each product through “nested” BOMs—the product BOM contains all the material suppliers, the material BOM contains all the yarn mills, and so on.
Now the real work begins
Bringing all six ESG KPIs into PLM takes real work and a lot of support from your suppliers. But the payoff is a supply chain you can finally see, measure, and improve with confidence. If you’re ready to streamline the heavy lift and turn ESG reporting into a strategic advantage, connect with your PTC team to start operationalizing these KPIs in PLM.
Up Next
The 6 supply chain ESG KPIs you should track
Start tracking ESG KPIs with PLM today
Learn More